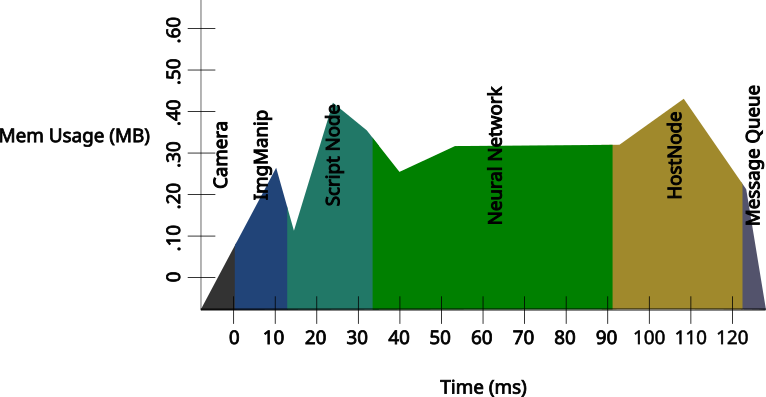
With the changes made for v3, specifically host nodes, it's starting to get a bit more complex to track how long a message spends in what place(and therefore where performance improvements can happen). I was considering this and also using the pytorch memory profiler to debug an unrelated project and had an idea for a similar profiler for depthai to measure the usage of a single frame and how much time to process
Something like this maybe?

This would also make diagnosing memory issues easier for the more casual user I think. Also could include error bars for both axes to represent variations such as taking 100 frames and having 5 of them take 20% longer(though this would probably be most helpful for script nodes that can feature heavily conditional logic).